Benchmarking
program director only or users with permissions to this tab
Purpose
Benchmarking is a tool that allows you to compare your program with other programs and with national averages.
Which programs have a Benchmarking page
Only programs that are accredited and that have completed at least one online annual report will have a Benchmarking tab in their system. The tab gets its data from the annual reports.
Fields
- New fields are frequently inserted in annual reports. Obviously, these fields will not appear in years before they were inserted.
- The system protects confidential information by limiting your ability to vary cohort groups for the same data fields.
- For confidential fields, you must select a minimum of five schools.
- You can run the same report with different peer cohorts, but to protect the confidentiality of individual programs, the system requires you to select at least two different schools in your cohort. This rule applies only to confidential fields,.
- Also to protect confidentiality, the system will automatically hide confidential fields, a if for any reason only one program is used to compute an average.
- For non-confidential fields, you must select a minimum of one program for your cohort.
The definition of confidential and non-confidential has been determined by the accrediting agency.
Main Benchmarking page
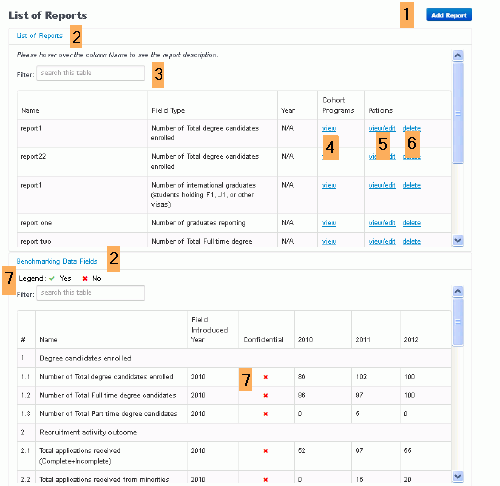 |
1 Add a new benchmarking report.
2 Click headings to open and close page sections. The default is for these headings to be open.
3 Filter reports by key word.
4 Link opens popup showing cohort list.
5 View/edit existing report.
6 Delete a report.
7 List of fields completed by program in the annual report . Confidential fields are indicated by a green check symbol and non-confidential fields by a red x.
|
Create report
Page as it appears before selection of field and sub field types
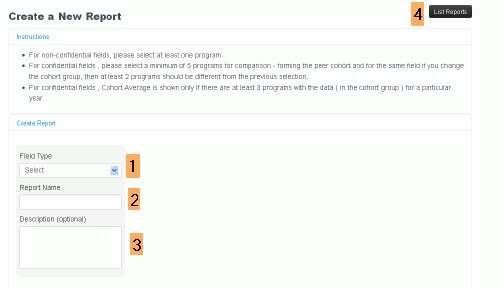 |
1 Select field or report type. The system will tell you whether this field is confidential or non-confidential and might open another drop down menu for a sub field.
2 Name the report.
3 Description is optional. Description will appear when you mouse over a report name on the main Benchmarking page.
4 Return to the main Benchmarking tab .
|
Page as it appears after selection of field and sub field types
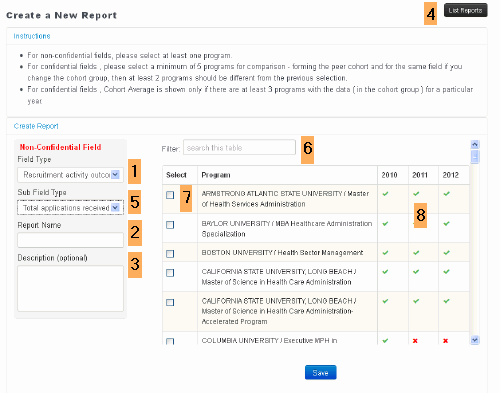 |
1 Select field or report type. The system will tell you whether this field is confidential or non-confidential and might open another drop down menu for a sub field.
5 Select sub field type if there is one.
6 Filter programs by key words.
8 Columns indicate years programs submitted reports. Red x's represent years program did not submit an annual report.
7 Select your report cohort, noting rules for the number of schools you need.
2 Name the report.
3 Description is optional. Description will appear when you mouse over a report name on the main Benchmarking page.
4 Return to the main Benchmarking tab .
|
View, modify & print graph
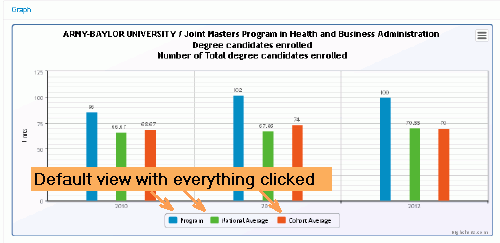
Most graphs will be bar charts, but some will be pie charts.
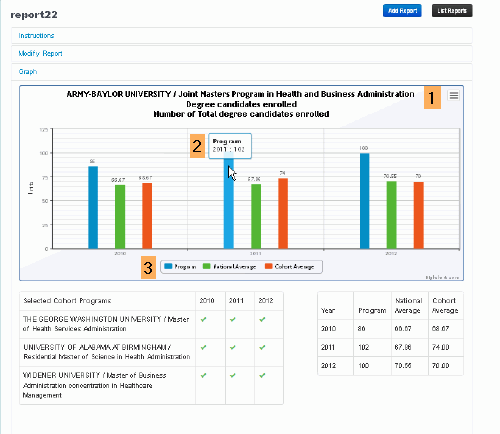 |
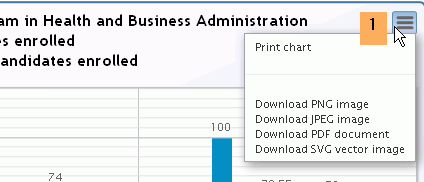
1 Option to print or download graph.
2 Mouse over for year and source of data .
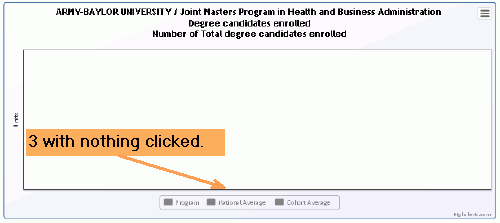
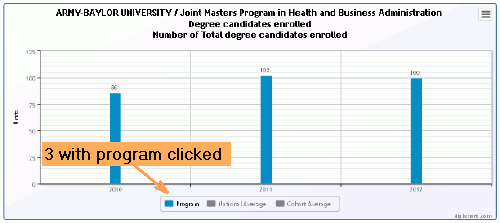
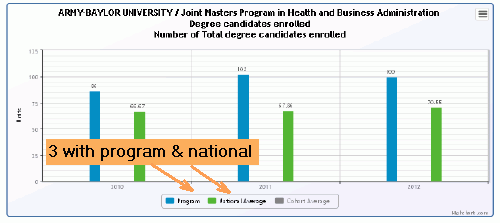
3 Click bars to show and hide data. View program, national, and cohort averages separately or together.
|
Detail for 1, print or download graph
Detail for 3, modify graph
Edit or modify report
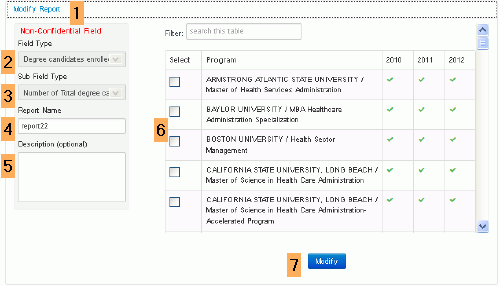 |
1 Make sure the Modify Report window is open.
4 , 5 , 6 Some fields are open for modification.
2 , 3 Other fields cannot be modified. If you want different fields or sub fields, you need to create a new report.
7 Click when finished.
|


